NATURAL GAS PRODUCTION
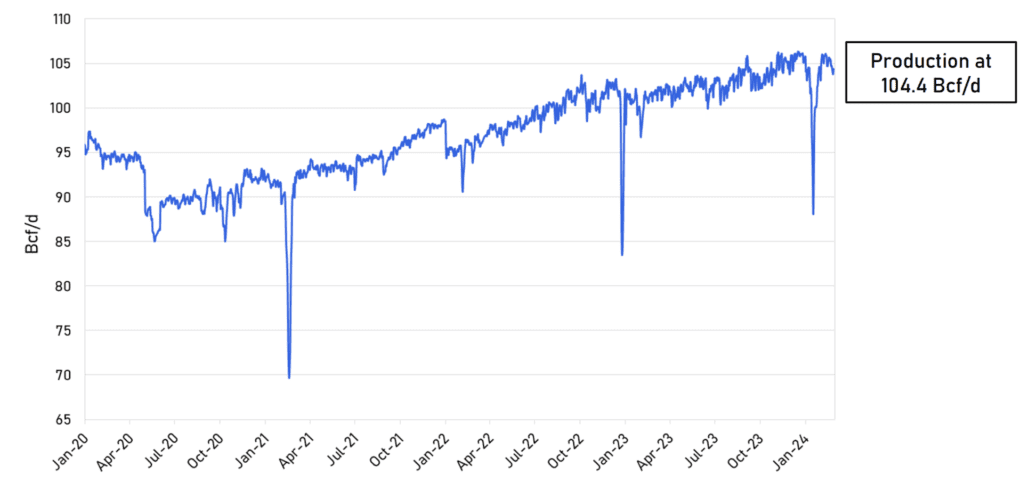
Gas Production continues to remain strong at 104 Bcf/d. This could result from Chesapeake Energy’s cutback in production, but that production slowdown is expected to take a few months to have an effect.
RUSSIAN PIPELINES TO THE E.U.
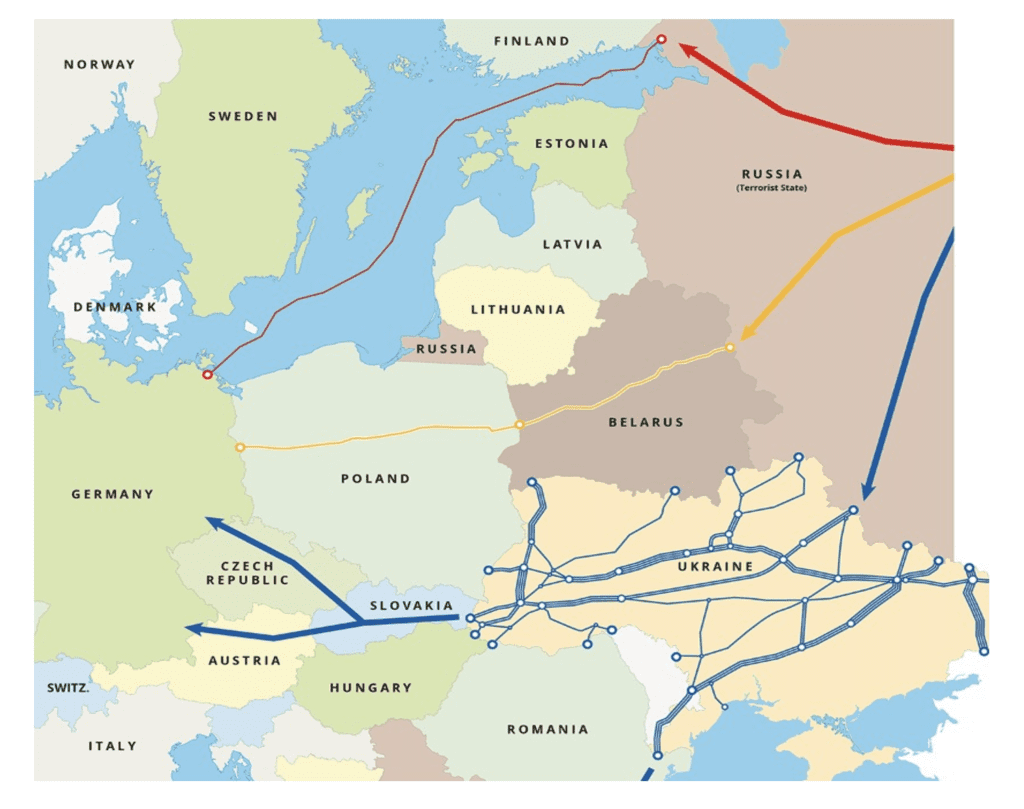
Believe it or not, some natural gas still flows from Russia to the E.U. through Ukraine. Whereas Russia used to supply about 40% of the EUS natural gas and 65% of Germany’s natural gas alone, many countries have cut back on Russian imports since the Russian invasion of Ukraine. The E.U. now receives about 1`3% from Russia. However, even this may stop at the end of the year as the Russo-Ukraine pipeline transport agreement expires at the end of the year.
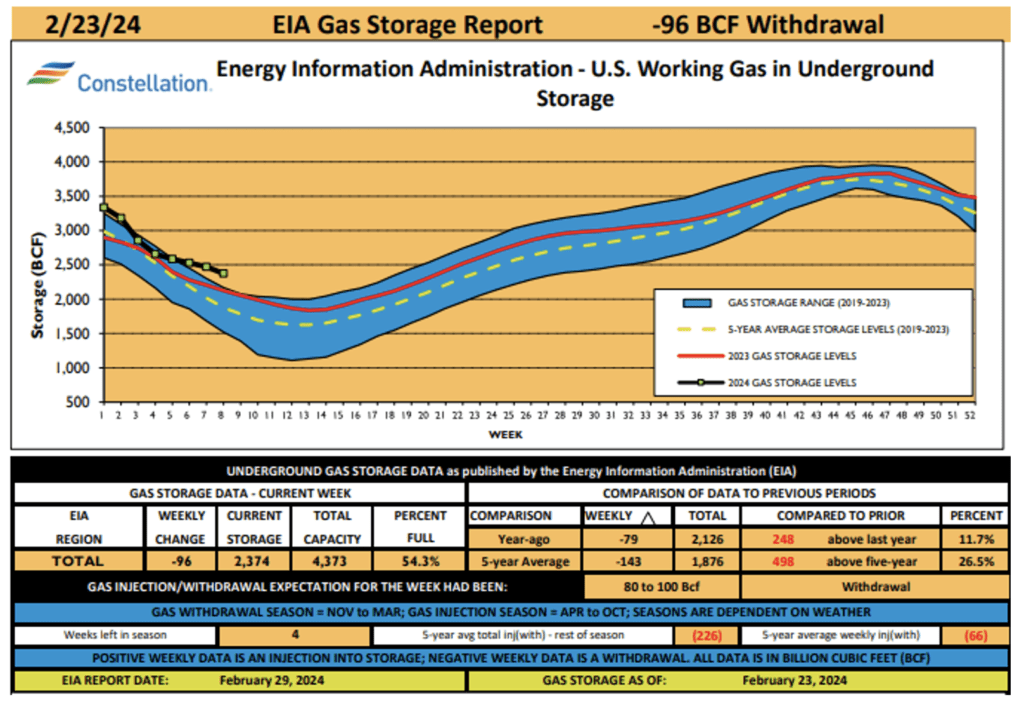
NATURAL GAS STORAGE
NYMEX NATURAL GAS PRICE VS. GLOBAL LNG PRICE
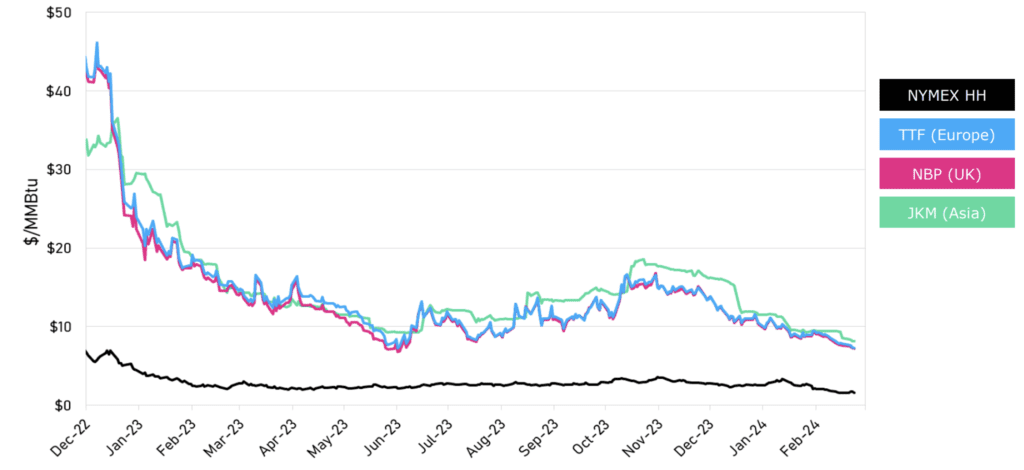
The Global price of LNG has fallen below ten dollars, the lowest in recent history. Europe put a lot of effort into building LNG receiving facilities and combined with a mild winter, they are currently at nearly 80% of natural gas capacity, with about 40% of that gas coming from U.S. LNG shipments
NYMEX CALENDAR STRIPS
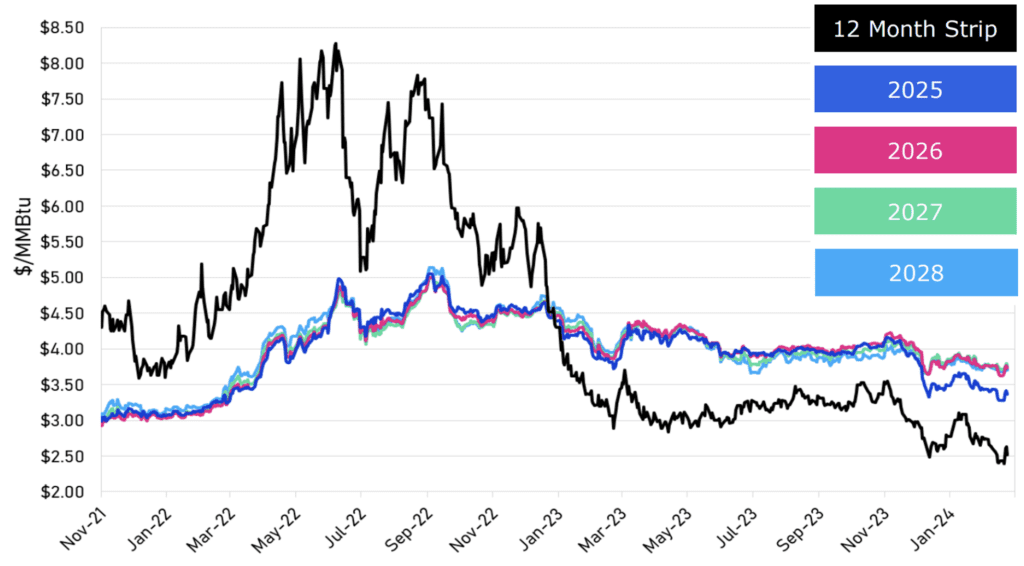
ALL ABOUT THE NYMEX TWELVE-MONTH STRIP
• The NYMEX Twelve Month Strip is the average of the upcoming 12 months of closing Henry Hub natural gas futures prices as reported on CME/NYMEX.
• A futures strip is the buying or selling of futures contracts in sequential delivery months traded as a single transaction.
• The NYMEX Twelve Month Strip can lock in a specific price for natural gas futures for a year with 12 monthly contracts connected into a strip.
• The average price of these 12 contracts is the particular price that traders can transact at, indicating the direction of natural gas prices.
• The price of the NYMEX Twelve Month Strip can show the average cost of the next twelve months’ worth of futures.
• The NYMEX Twelve Month Strip is also used to understand the direction of natural gas prices and to lock in a specific price for natural gas futures for a year.
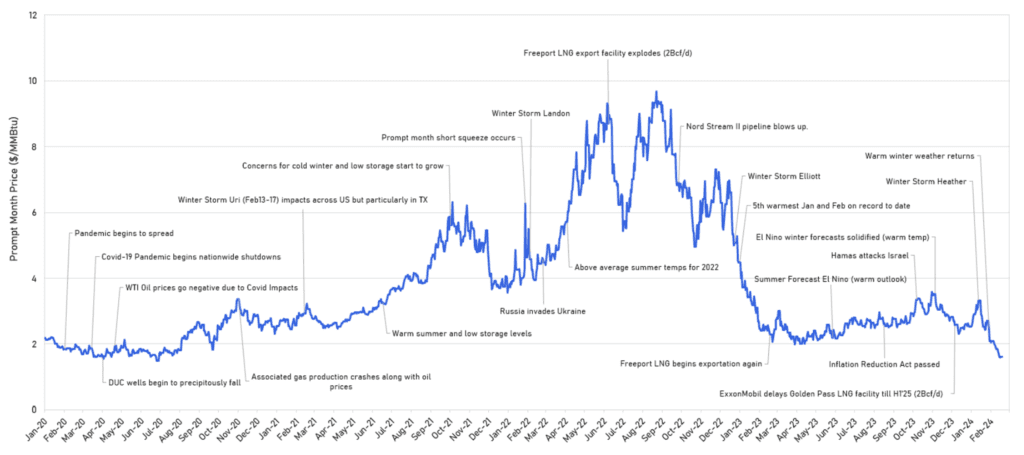
ANNOTATED PROMPT MONTH PRICING WITH NOTABLE EVENTS
WEATHER: 6-10 DAY AND 8-14 DAY OUTLOOK
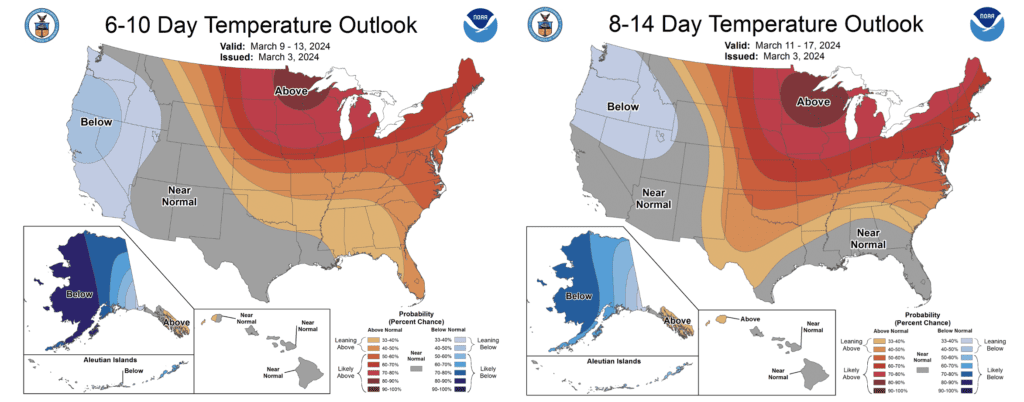
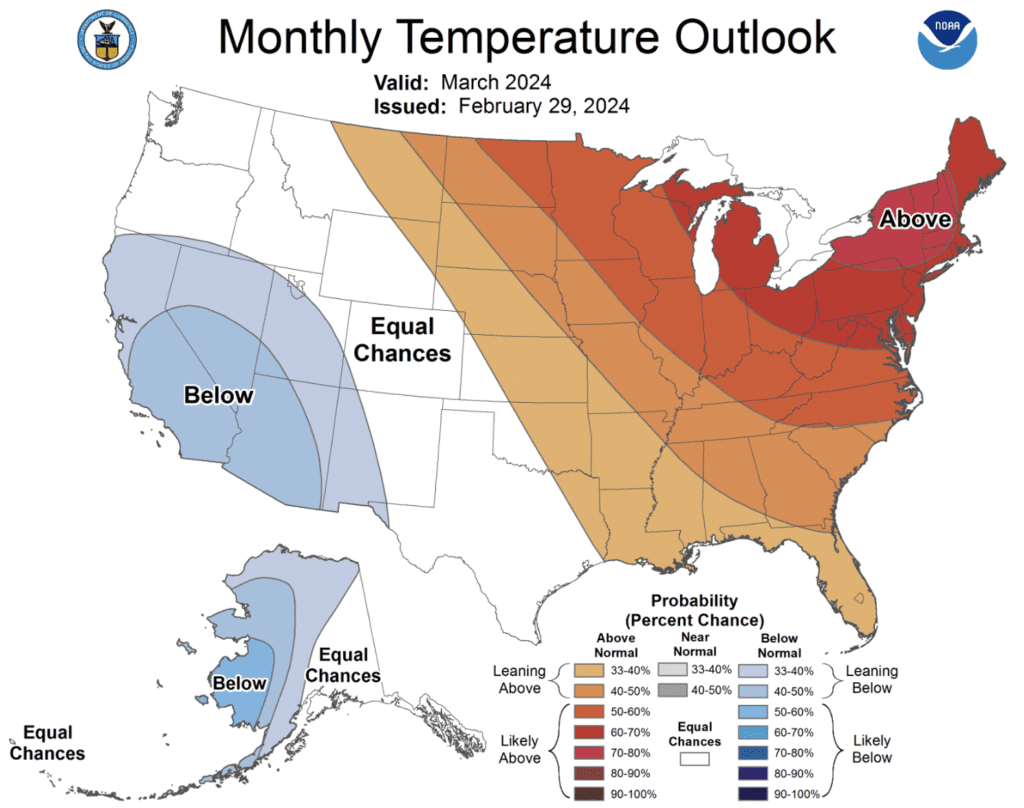
After a slightly higher-than-expected withdrawal last Thursday, prices have begun to sink again, mainly on forecasts of warmer weather. According to the NOAA, March looks primarily average in the west, with below-average temperatures in the ordinarily warm Southern California, Nevada, and Arizona regions. The eastern half of the U.S., especially the heavily populated Northeast, can expect well above average temperatures.
From March 4th to March 10th, here’s what you can expect across the United States:
- West Coast: Prepare for rain and snow with temperatures ranging from the 30s to 50s°F.
- Eastern 2/3 of the U.S.: A robust high-pressure system will dominate, bringing relatively mild to warm conditions. Expect highs in the 50s to 70s°F for the Midwest and Northeast, although some colder spots in the Northern Plains may see temperatures in the 20s to 30s°F.
- Central, Southern, and Eastern U.S.: These regions will experience pleasant weather with highs ranging from the 50s to 80s°F, leading to light demand for heating.
- Overall, the next 5-6 days will see very light demand for heating across much of the country, with slightly more robust demand expected next weekend.
NOAA FORECAST FOR THE MONTH OF MARCH
