EIA: NATURAL GAS STORAGE REPORT
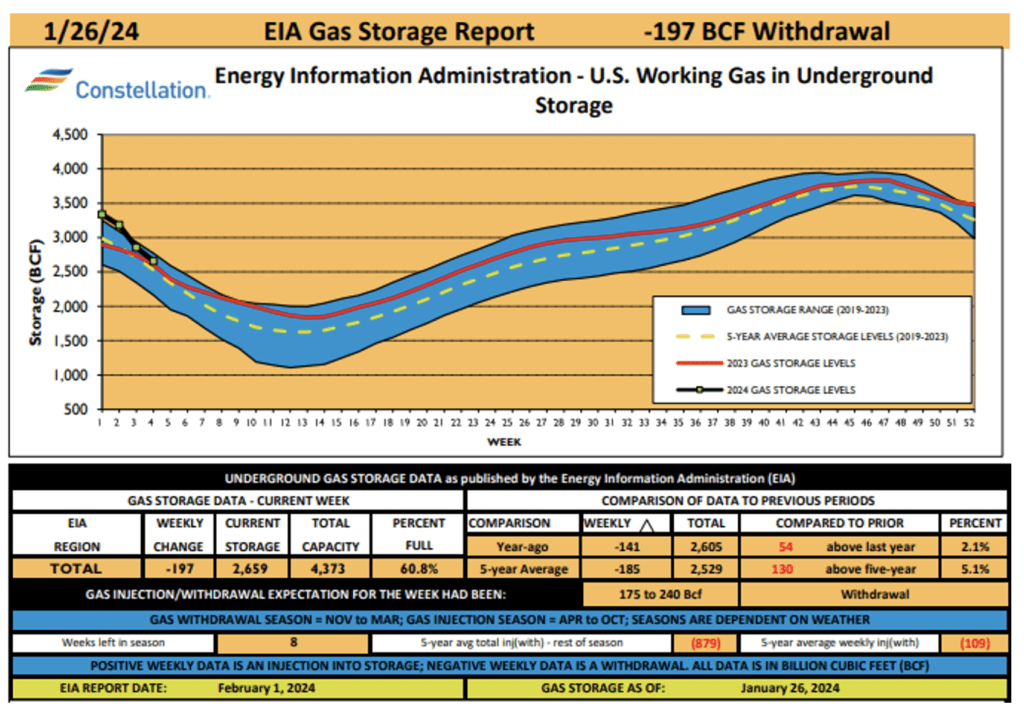
With the cost of natural gas climbing due to the added cost of gas from the Middle East, US LNG producers are maxing out the capacity of LNG facilities to sell their products where they can make the most money. It’s a global market, and NG producers will try to sell it where the highest profit is.
This means less gas storage domestically. If not for the added LNG exports, we would be below $2.00 for prompt month gas.
WHEN IS THE BEST TIME TO BUY NATURAL GAS? WHEN IS THE BEST TIME TO BUY ELECTRICITY?
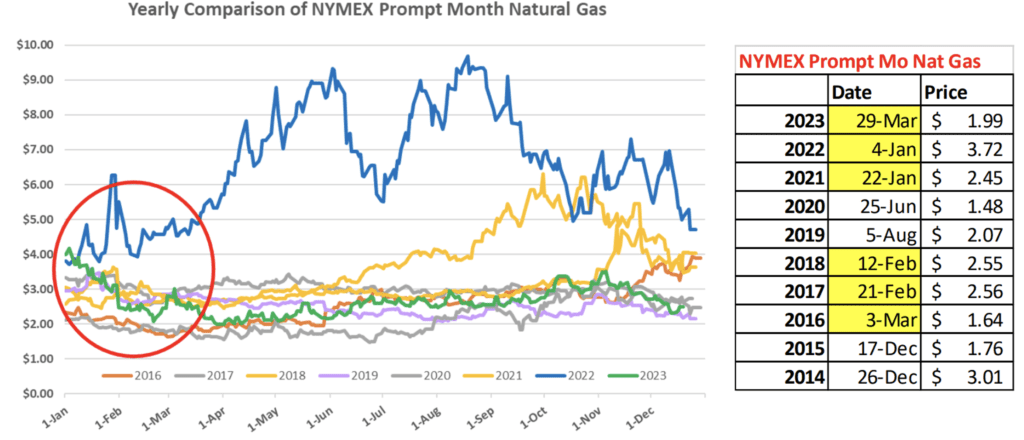
In the past, customers were always recommended to buy their energy in shoulder months like April and May or October and November.
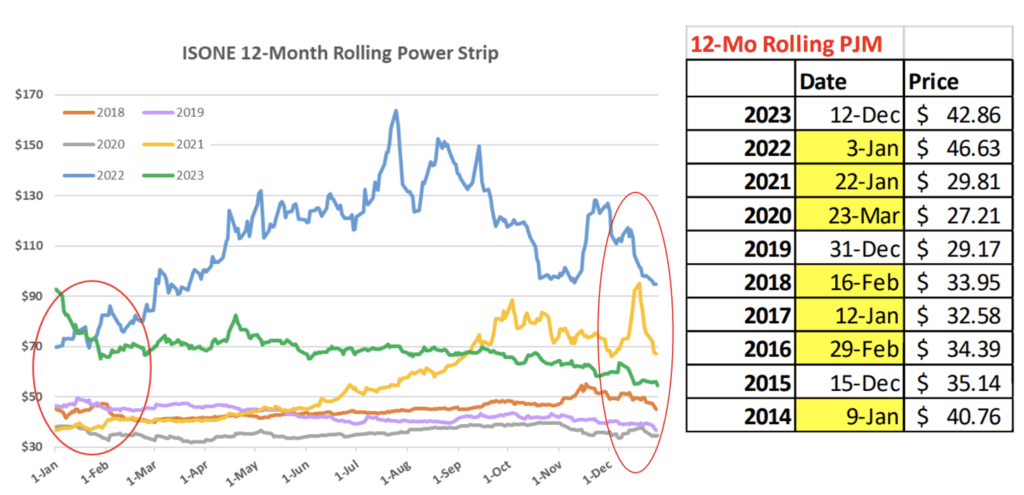
But, historically, over the last ten years, NOW is the best time to buy energy. Natural gas was best purchased in January through March in six of the previous ten years, and electricity was purchased during the same time in seven of the last ten.
BUY NOW.
6-10 DAY AND 8-14 DAY OUTLOOK
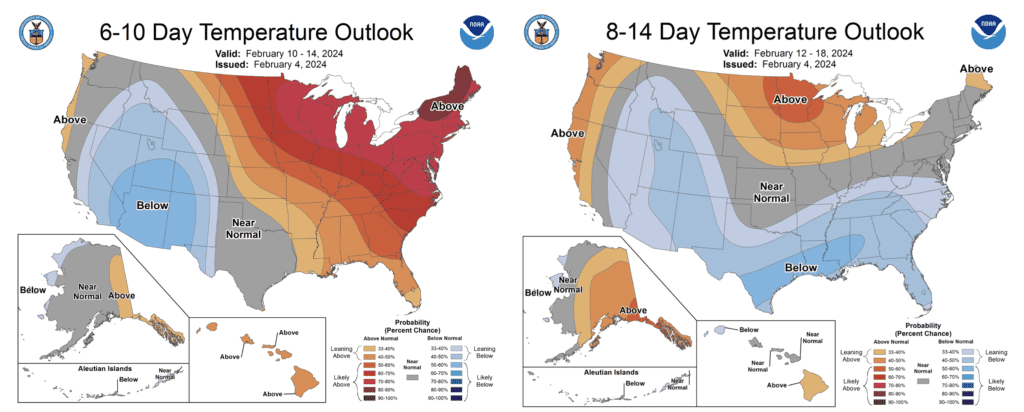
Get ready for some interesting weather across the US this week! We’ve got rain and snow on the way, with a strong storm already making waves in California.
Temperatures will be mostly average or even a bit warmer than usual in most places this time of year. Up north, expect highs in the 40s to 50s, with some spots dipping into the 20s and 30s. It will be mild to downright lovely down south, with highs ranging from the 50s to the 70s.
Overall, it looks like the next seven days will bring pretty light weather activity across the country.
NYMEX CALENDAR STRIPS
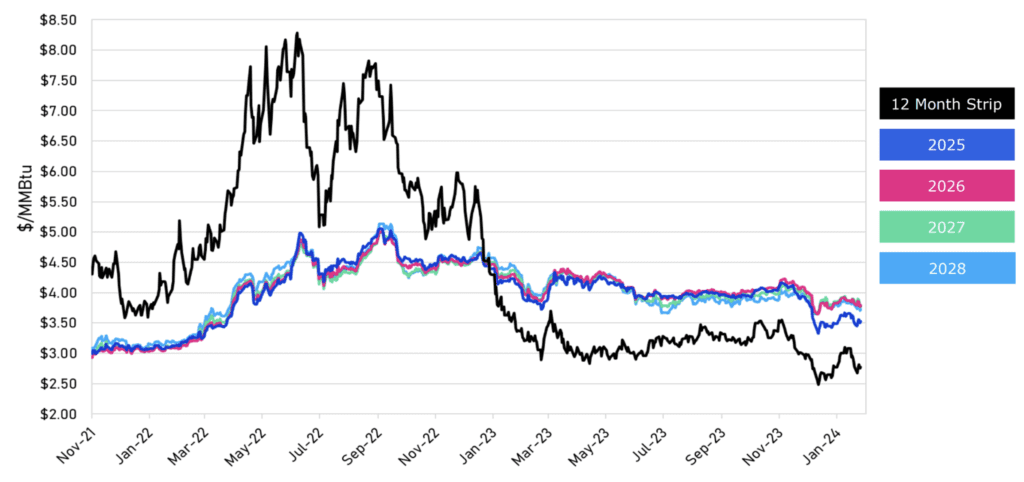
ALL ABOUT THE NYMEX TWELVE-MONTH STRIP
- The NYMEX Twelve Month Strip is the average of the upcoming 12 months of closing Henry Hub natural gas futures prices as reported on CME/NYMEX.
- A futures strip is the buying or selling of futures contracts in sequential delivery months traded as a single transaction.
- The NYMEX Twelve Month Strip can lock in a specific price for natural gas futures for a year with 12 monthly contracts connected into a strip.
- The average price of these 12 contracts is the particular price that traders can transact at, indicating the direction of natural gas prices.
- The price of the NYMEX Twelve Month Strip can show the average cost of the next twelve months’ worth of futures.
- The NYMEX Twelve Month Strip is also used to understand the direction of natural gas prices and to lock in a specific price for natural gas futures for a year.
A TIMELINE OF WEATHER & POLITICAL EVENTS AFFECTING GAS PRICING
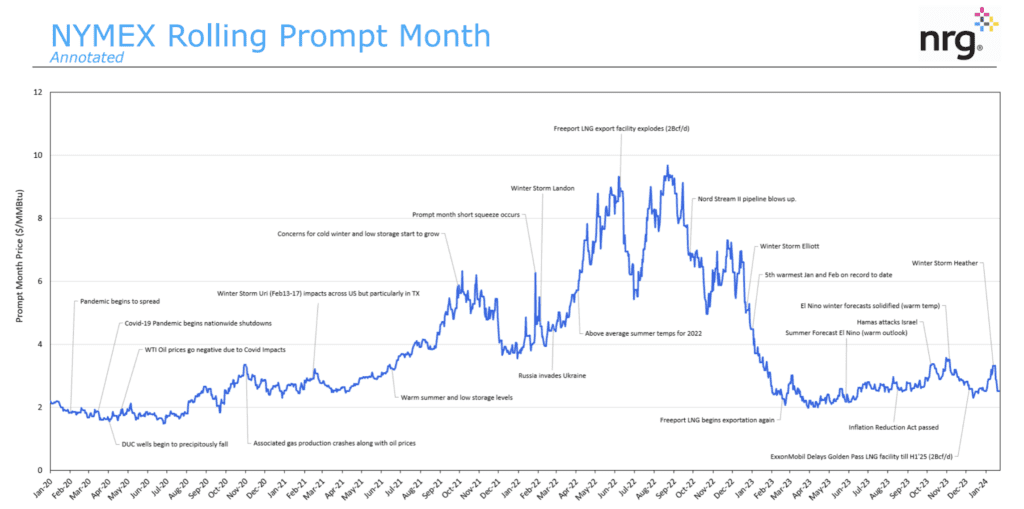
The overall trend of electricity is going down, but you must always keep track of weather and geo-political events to determine their effect on the market. Looking over the past four years, you can see that events beyond the weather often cause spikes or drops in the market.
OIL & GAS PRODUCING REGIONS IN DANGER OF CONFLICT
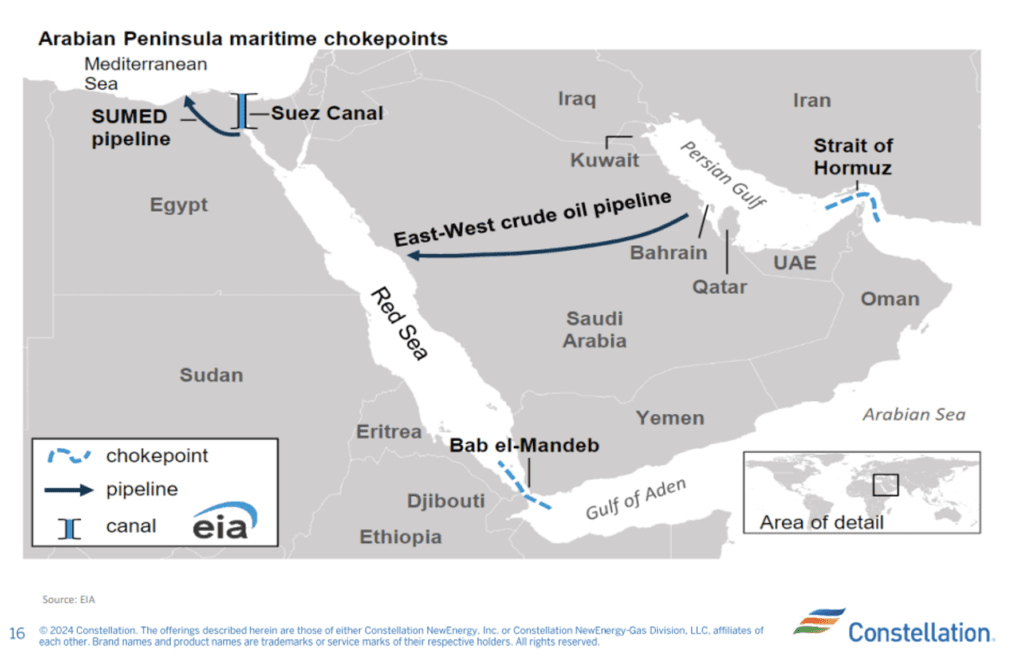
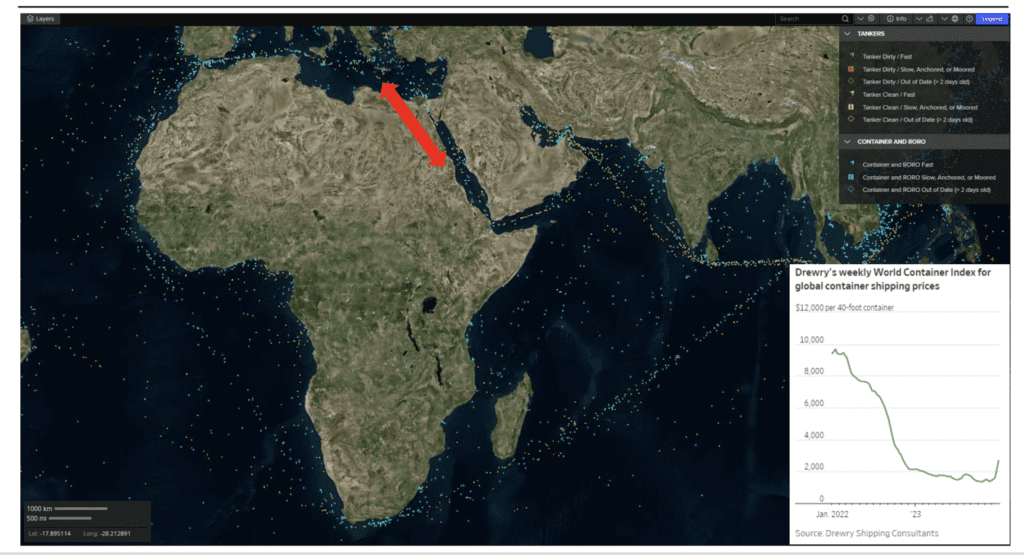
The situation in the Middle East has begun to threaten oil and gas supplies from Middle East exporters such as Qatar and Saudi Arabia. With Hamas supporters such as the Houthi rebels in the Gulf of Aden and Iran in the Persian Gulf, much of the shipping has had to take an alternate route around the Cape of Good Hope.
This route costs more in fuel, and the added insurance has been passed on to customers. The container cost has doubled from nearly $1,500 to almost $3,000.
PRICIER ROUTES OIL & GAS TANKERS MUST TAKE DUE TO MIDDLE EAST UNREST
